
Technical Tutoring Home · Site Index · Advanced Books · Speed Arithmetic · Math Index · Algebra Index · Trig Index · Chemistry Index · Gift Shop · Harry Potter DVDs, Videos, Books, Audio CDs and Cassettes · Lord of the Rings DVDs, Videos, Books, Audio CDs and Cassettes · Winnie-the-Pooh DVDs, Videos, Books, Audio CDs, Audio Cassettes and Toys · STAR WARS DVDs and VHS Videos
Quadratics and the Quadratic Formula: Theory and Graphing
Three types of quadratic equations · Solving the equation · Graphing the equation · Changing the value of x0 · Changing the value of y0 · Changing the amplitude, a · Analytical connection between the standard forms · Example - Graphing a quadratic · Example - Finding a quadratic from a graph · Algebra Index · Recommended Books
The three types of quadratic equations
Every quadratic equation describes a parabola, which looks like this graph.
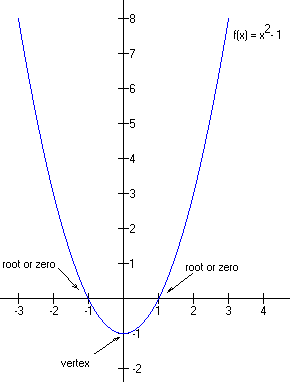
The graph looks a little like a cup, and the bottom of the cup is called the vertex. The mouth of the cup keeps getting larger to infinity. For the most part, we will be interested in the region around the vertex.
The cup is upright (vertex down) when a > 0, upside down (vertex up) when a < 0. The case a = 0 renders the equation linear, not quadratic, so we won’t consider that case here.
There are three important cases of quadratics depending on where the graph crosses the x-axis (these points are called roots or zeros of the equation). In case I, two distinct, real roots, the vertex lies on the opposite side of the x-axis from the rest of the graph and so the curve must cross the x-axis exactly twice. One can see exactly where the roots are from the graph, and they are clearly real numbers. Analytically, this case corresponds to the portion of the quadratic formula under the radical (the discriminant) being strictly positive:
![]()
Case I, two real, distinct roots
The graph above is an example of Case I.
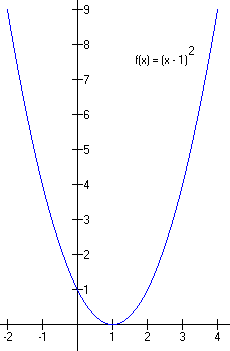
If the vertex is exactly on the x-axis, there is only one real root (case II). Analytically, this corresponds to the discriminant equal to zero:
![]()
Case II, exactly one real root
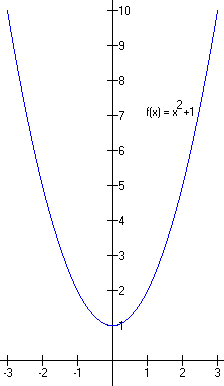
If the vertex lies entirely on the same side of the x-axis as the rest of the graph, then the curve never touched the x-axis, never crossed either. There are no real roots, but there are complex roots and they always come in matched pairs called complex conjugates. This is case III. Analytically, this corresponds to negative values of the discriminant:
![]()
Case III, two complex conjugate roots
There are many ways to play with the equations to emphasize different qualities we might want to consider in detail. In general, there are two big things we want to do with a quadratic equation: solve it for all possible values of x, or graph the equation.
There are three main methods of solving quadratics: Guessing the solutions (also known as the double parentheses method), completing the square, and using the quadratic formula. Each has advantages and disadvantages in any given situation. We have dealt with methods of solving quadratics in each of these ways elsewhere (follow the links for a detailed discussion).
There is a special form of a quadratic that is best for graphing the equation. We'll analyze it thoroughly here.
![]()
Here y0 is the y coordinate of the vertex, x0 is the x coordinate of the vertex, and a is the amplitude, a measure of the "thickness" of the parabola. It is best to compare different parabolas against the simplest example where y0 = x0 = 0 and a = 1. This parabola is the graph of the simplest possible parabola, and looks like this:
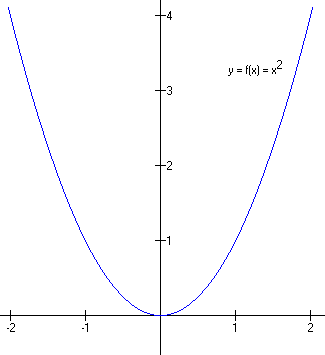
Notice that the vertex is at (x0, y0) = (0, 0) and that y(-1) = y(1) = 1. Thus, the vertex is at the origin and the parabola has unit amplitude.
When the value of x0 is changed, the parabola moves to the left (x0 negative) or to the right (x0 positive) a distance | x0 |. This is easy to get mixed up since the value of x0 is subtracted in the equation, which makes it look like the sign has been reversed. Some examples will help clear this up.
In the graph below, x0 = -1 is negative, so the vertex is moved one unit to the left.
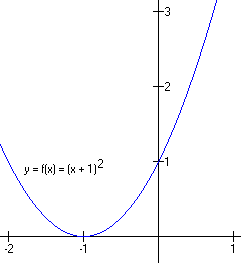
The equation, however, looks as though we are adding 1 to x:
![]()
In other words,
![]()
In short, positive values added to x in the equation move the graph to the left, toward more negative values. The value of x0 is negative, but the appearance of the number in the equation is positive. This takes some practice to remember.
Conversely, when x0 is positive, the number appears to be subtracted from x and the graph looks like this:
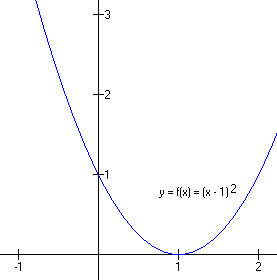
And so a value subtracted from x in the equation moves the graph to the right, toward more positive values. The value of x0 is positive, but the appearance of the number in the equation is negative. This is a great source of confusion to students, and is well worth going over again and again until very well understood.
The situation is similar with the y0 value - things appear backwards due to the way the equation is customarily written. Again, there is nothing wrong with the equation, since it is subtracted, the sign is apparently reversed. When y0 is positive, the number appears in the equation to be negative, and the graph is higher by y0 number of units. When y0 is negative, the number appears to be positive, and the graph is lower.
Here are two examples.
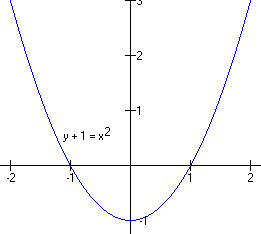
In this case y0 = -1, and the graph has been lowered by one unit. In the other case,
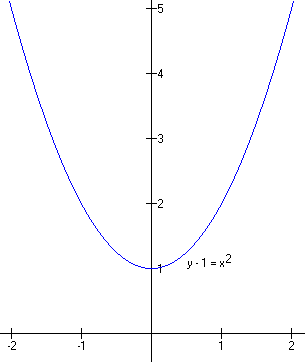
y0 = 1, and the graph has been raised one unit.
Making "a" smaller produces a fatter parabola, while making "a" larger produces a skinnier parabola. When "a" is positive, the cup faces up, while negative causes the cup to face down. In each case, it is best to compare with a normal parabola.
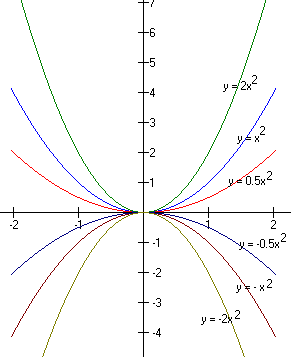
Notice first that negative values of "a" produce upside-down parabolas, but the vertices are all in the same place. Compared with |a| = 1, the two parabolas with |a| = 0.5 are fatter, while the two parabolas with |a| = 2 are skinnier. The numbers with smaller absolute values make the parabola apparently larger (although really the values at each x are smaller by comparison) while the numbers with larger absolute values make the parabola appear smaller (although the actual values at each x are larger). Again, this can be confusing, but careful consideration and lots of practice will make it clear.
Analytical connection between the standard forms
Before trying to put all the information above together, we should go through the algebraic connection between the standard form for graphing and the standard form for solving via the quadratic equation. Please note that we are ignoring the standard form for completing the square, since it is pretty easy to get this once the quadratic form is known.
Starting with the standard graphing form, we can manipulate the algebra
![]()
Putting this form equal to the standard quadratic formula gives us
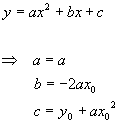
This allows us to translate from the graphical form of the equation to the quadratic form. To go the other way, we invert the equations to get
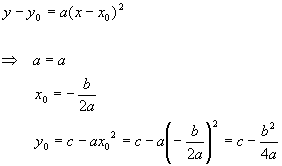
Admittedly, these relations are a little awkward, but they do allow straightforward conversion from one form of the quadratic to the other. Now we show how to use these methods to graph some quadratics.
Example - Graphing a quadratic
Graph the equation
![]()
Solution
First, we need to identify the three constants: a = 2, b = -4 and c = 3. Then, these are plugged into the conversions for x0 and y0:
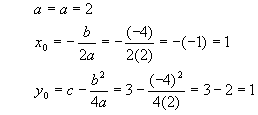
Putting these results into the standard graphical form yields
![]()
This is an upright parabola (a > 0) with vertex at (x0, y0) = (1, 1) which is skinny compared with a "normal" parabola (a = 2 instead of a = 1). If you like, you can plot three points: x = 1 => y = 1, x = 0 => y = 3 and x = 2 => y = 3. The graph looks like this
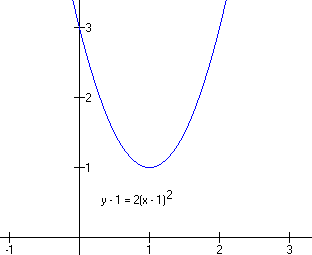
Example - Finding a quadratic from a graph
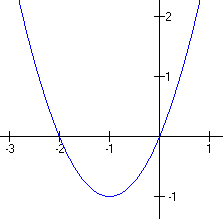
Looking at this graph, find the standard quadratic form for the equation.
Solution
This type of problem is best done "naively", that is, let's assume that we see what we think we see and avoid getting too technical about the points on the graph. It appears that we can identify three points on the graph:
(x, y) = (-2, 0), (-1, -1) and (0, 0)
Since the vertex is clearly at (-1, -1), it seems clear that x0 = -1 and y0 = -1. We still need the amplitude, so let's take one of the points, say (0, 0), and plug it into the graphical form. In that case,
![]()
Now we have all the graphical form constants, we can just plug into the conversion equations to get

So our final answer, the quadratic form, comes out to be
![]()
This is one area in particular where it really pays to do a very large number of problems. Graphing skills are extremely useful and are constantly used in more advanced math, chemistry, physics, business and engineering. The ability to go from an equation to a graph and vice-versa is literally an indispensable skill. Getting very good at it now will save a great deal of trouble later, and will probably serve you very well in your career later.

The classic algebra problem book - very light on theory, plenty of problems with full solutions, more problems with answers

A simplified and updated version of the classic Schaum's Outline. Not as complete as the previous book, but enough for most students